BMW Statistics By Revenue, EBIT, Car Shipment, Unit Sales, Brand Value and Facts

Updated · Mar 10, 2025


TABLE OF CONTENTS
- Introduction
- Editor’s Choice
- General BMW Analysis
- BMW Group’s Financial Services Segment
- BMW Statistics By Revenue
- BMW Segmental Revenue Statistics
- BMW Automobile Sales Statistics By Region
- BMW Group’s Statistics By Car Shipment
- BMW Vehicle Sales Statistics By Segment
- Luxury Car Brands Statistics By Unit Sales
- Leading Brands Statistics By Brand Value
- BMW Statistics By Car Registration, Ownership, Imports, Export And Scrapped
- BMW Group’s Monthly Launches In 2024
- BMW Website Traffic Statistics By Country
- BMW’s Sustainable Initiatives
- Conclusion
Introduction
BMW Statistics: BMW is a famous German company that makes luxury cars and motorcycles. Founded in 1916, it has become one of the top automobile brands in the world. BMW is known for its high-quality vehicles, advanced technology, and strong performance. The company sells cars in many countries and competes with brands like Mercedes-Benz and Audi.
In recent years, BMW has focused on electric vehicles (EVs) and new technology to stay ahead in the market. Its popular models include the BMW 3 Series, X5, and the electric iX. With strong sales and a growing market share, BMW continues to be a leader in the automobile industry. It invests heavily in innovation to build safer, smarter, and more eco-friendly vehicles.
Editor’s Choice
- BMW Statistics show that in 2024, the BMW Group, encompassing BMW, MINI, and Rolls-Royce, delivered 2,450,804 vehicles worldwide, marking a 4% decrease from the previous year.
- Meanwhile, the core BMW brand sold 2,200,177 vehicles globally, a 2.3% decline compared to 2023.
- Sales of all-electric BMW and MINI models reached 426,594 units, representing a 13.5% increase and accounting for 17.4% of total sales.
- BMW M GmbH achieved a record by selling 206,582 high-performance vehicles, with the electric i4 M50 being the top seller for the third consecutive year.
- In the United States, BMW brand sales rose by 2.5%, totaling 371,346 vehicles, setting a new record for the second consecutive year.
- BMW’s sales in China dropped by 13.4%, reflecting challenges in one of its key markets.
- BMW’s net profit plummeted by 83.8% to €476 million in the third quarter of 2024, primarily due to weak demand in China and issues related to braking systems. BMW’s operating profit margin was projected to be between 6% and 7% for the full year.
- A recall of 1.5 million vehicles due to defective brakes supplied by Continental significantly affected BMW’s financial results and market perception.
- Despite a 2.3% drop in sales, BMW outperformed rivals Mercedes-Benz and Audi, which saw declines of 3% and 12%, respectively. This highlights BMW’s relative resilience in a challenging market.
General BMW Analysis
- In the first quarter of 2024, BMW Group sold 594,671 vehicles worldwide, marking a 1.1% rise from early 2023.
- The BMW brand alone sold 531,039 units, a 2.5% increase from the same period last year.
- Revenue from BMW’s automotive sector for Q1 2024 reached €29.95 billion (about USD 32.6 billion).
- In the United States, BMW Group’s sales climbed to 90,844 vehicles, which was 1.2% higher than in Q1 2023.
- Among these, 84,475 vehicles carried the BMW badge, marking a 2.4% rise from last year.
- BMW Statistics further stated that the sales of electric BMW models in the U.S. surged by 63%, with 10,713 units sold.
- BMW Motorrad, the company’s motorcycle division, delivered 46,434 motorcycles and scooters in Q1 2024, 3.1% fewer than the record-breaking numbers from Q1 2023.
- Despite the dip, BMW Motorrad achieved its best-ever March, selling over 24,000 units in a single month.
- To stay ahead in the industry, BMW invested heavily in research and development (R&D), increasing its spending by €200 million (around USD 218 million) compared to Q1 2023.
- The R&D ratio for the quarter stood at 5.4%, highlighting BMW’s focus on innovation.
- The company allocated €1.3 billion (approximately USD 1.42 billion) towards new models and advanced technologies, including automated driving systems.
- BMW’s official website, bmw.com, saw 1.5 million visits in May 2024, reflecting a 4.59% growth from April. However, the bounce rate remained at 50.9%.
You May Also Like To Read
- Audi Statistics
- Alfa Romeo Statistics
- Aston Martin Statistics
- Bentley Statistics
- Bugatti Statistics
- Chevrolet Statistics
- Citroën Statistics
- Daihatsu Statistics
BMW Group’s Financial Services Segment
- New Contracts: The number of new contracts with retail customers grew by 21.5% year-on-year, reaching 422,000 contracts.
- Volume of New Business: This segment experienced a 22.1% increase in new business volume, totaling over €15.6 billion (approximately USD 17.01 billion).
- Segment Earnings: Despite this growth, segment earnings decreased to €730 million (around USD 796 million) due to higher credit risk provisions and the normalization of income from the resale of lease returns.
BMW Statistics By Revenue
- BMW reported revenues of €155.5 billion (approximately USD 166.86 billion) for the fiscal year 2023.
- In the third quarter of 2024, BMW’s revenue declined by 15.7% to €32.4 billion (approximately USD 34.4 billion),
- he net profit plummeted by 83.8% to €476 million (approximately USD 508.73 million), compared to €2.93 billion in Q3 2023.
- Analysts anticipate BMW’s revenue to grow at an annual rate of 2.4% in 2025, which is slower than the German market’s projected growth rate of 5.8%.
- The revenue for BMW’s SUV market is projected to reach USD 38 billion in 2025.
- BMW has maintained its position as the leading vehicle exporter to the United States, exporting approximately 225,000 vehicles annually and generating over USD 10 billion in revenue.
 (Reference: statista.com)
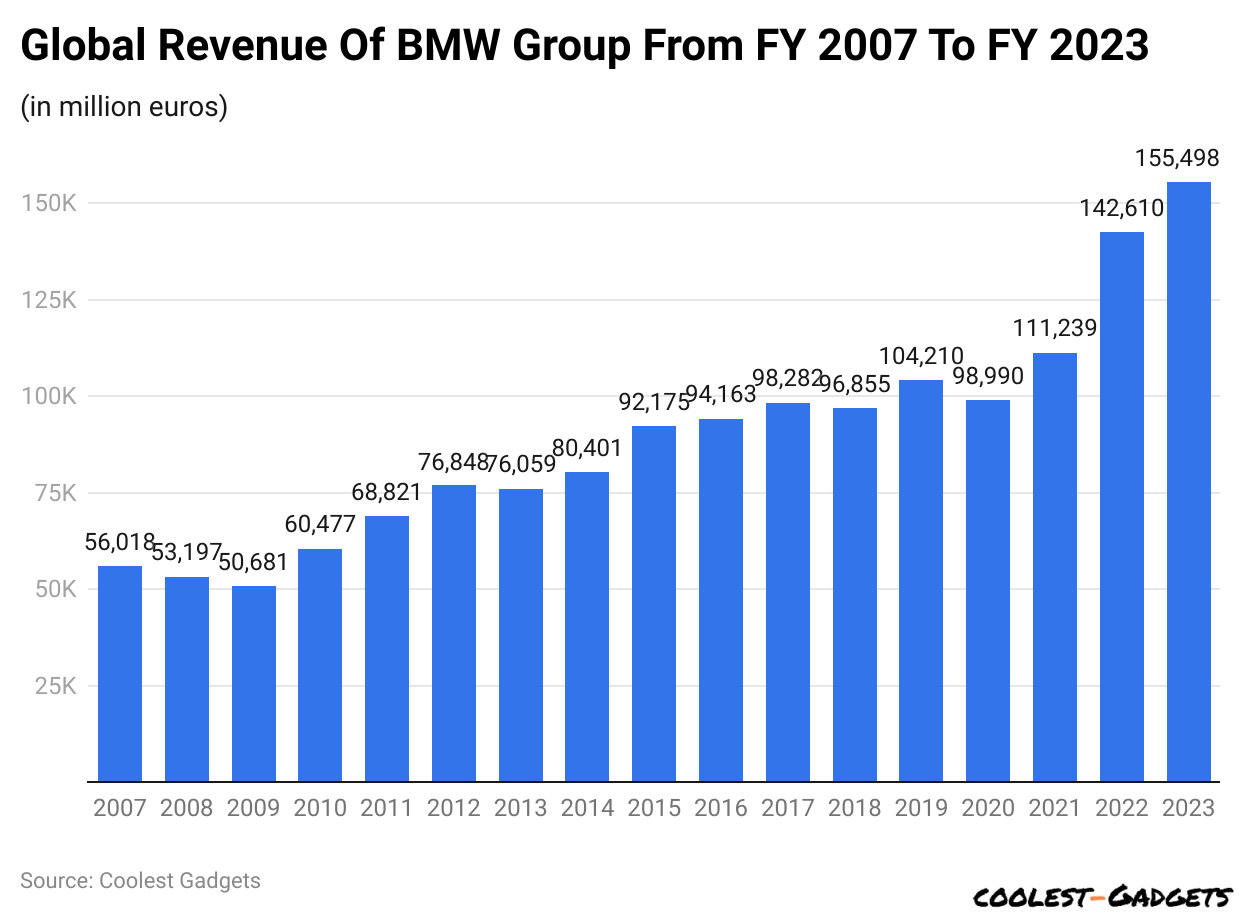
- A report published by Statista elaborates that the total revenue generated by BMW in F.Y. 2023 was around 155,498 million euros, representing (USD 1,66,864.90 million), a decrease from 142,610 million euros (USD 1,53,034.79 million) in 2022.
In contrast, the amount of revenue generated between 2007 and 2021 is detailed below:
| Year | Revenue (in million euros) | Revenue (in USD million) |
| 2021 | 111,239 | 1,19,370.57 |
| 2020 | 98,990 | 1,06,226.17 |
| 2019 | 104,210 | 1,11,827.75 |
| 2018 | 96,855 | 1,03,935.10 |
| 2017 | 98,282 | 1,05,466.41 |
| 2016 | 94,163 | 1,01,046.32 |
| 2015 | 92,175 | 98,912.99 |
| 2014 | 80,401 | 86,278.31 |
| 2013 | 76,059 | 81,618.91 |
| 2012 | 76,848 | 82,465.59 |
| 2011 | 68,821 | 73,851.82 |
| 2010 | 60,477 | 64,897.87 |
| 2009 | 50,682 | 54,386.85 |
| 2008 | 53,197 | 57,085.70 |
| 2007 | 56,018 | 60,112.92 |
By EBIT
- As mentioned in BMW Statistics, the company’s Earnings Before Interest and Taxes (EBIT) for 2024 are projected to be approximately €15.95 billion (around USD 17.2 billion).
- Analysts forecast the group’s EBIT to be around €15.59 billion (approximately USD 16.8 billion) in 2025.
 (Reference: statista.com)
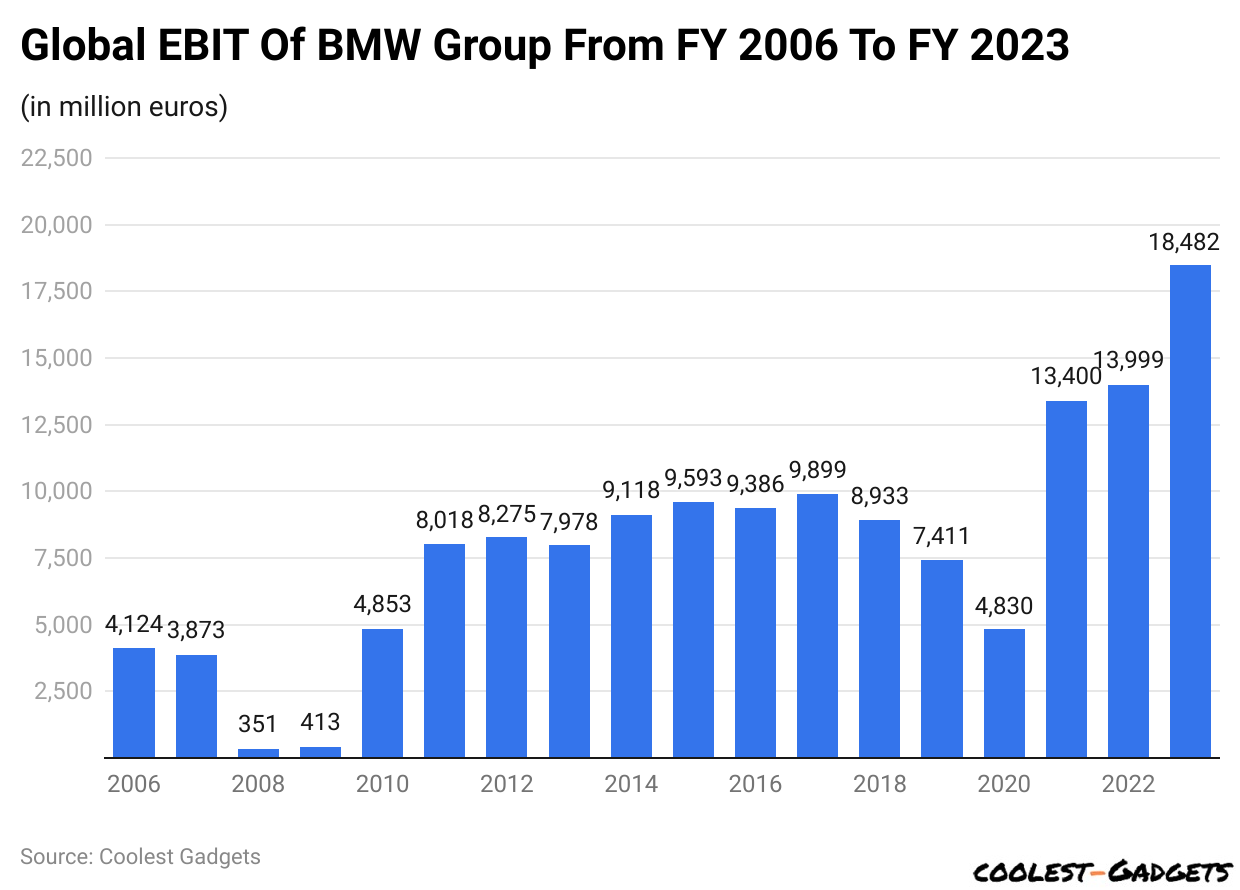
- BMW Statistics 2023: BMW Group achieved a global EBIT (Earnings Before Interest and Tax) of approximately 18.5 billion euros (USD 19.85 billion).
- This marks a 32% increase compared to the previous year when the company reported around 14 billion euros (USD 15.02 billion) in EBIT.
- However, in Q1 of 2024, the total earnings before interest and taxes (EBIT) was about USD 4.0 billion.
By Assets
 (Reference: statista.com)
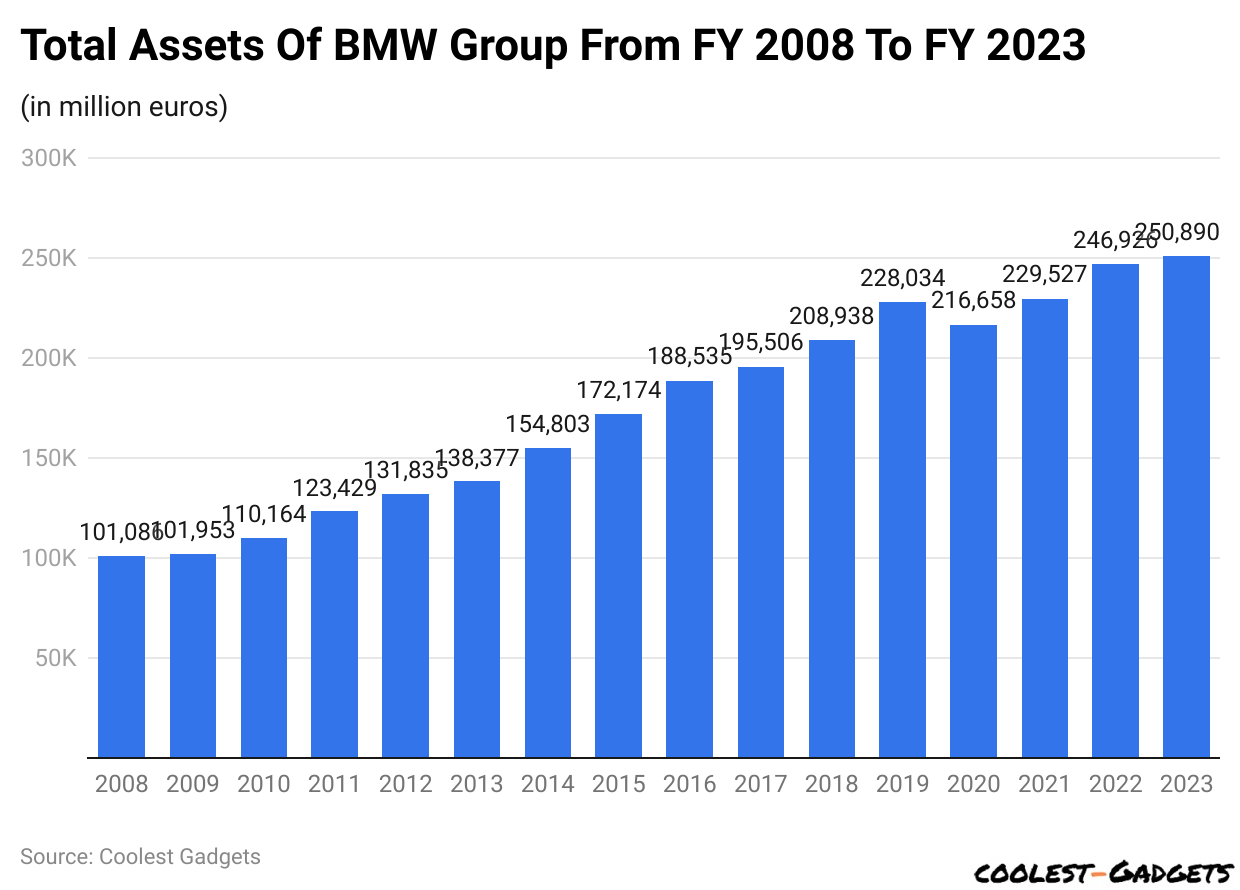
- BMW Statistics reports that BMW Group’s total assets amounted to approximately 250.9 billion euros (USD 69.22 billion) in 2023, reflecting a 1.6% year-over-year increase.
- In the first quarter of 2024, BMW Group reported a solid financial position with total assets amounting to €250.9 billion (approximately USD 273.5 billion).
BMW Segmental Revenue Statistics
- Similarly, in the first quarter of 2024, the automotive segment generated approximately €29.95 billion (around USD 32.6 billion).
- Revenue earned by other segments in the same period are Financial Services (USD 6.8 billion) and Motorcycles (USD 1.0 billion).
 (Reference: statista.com)
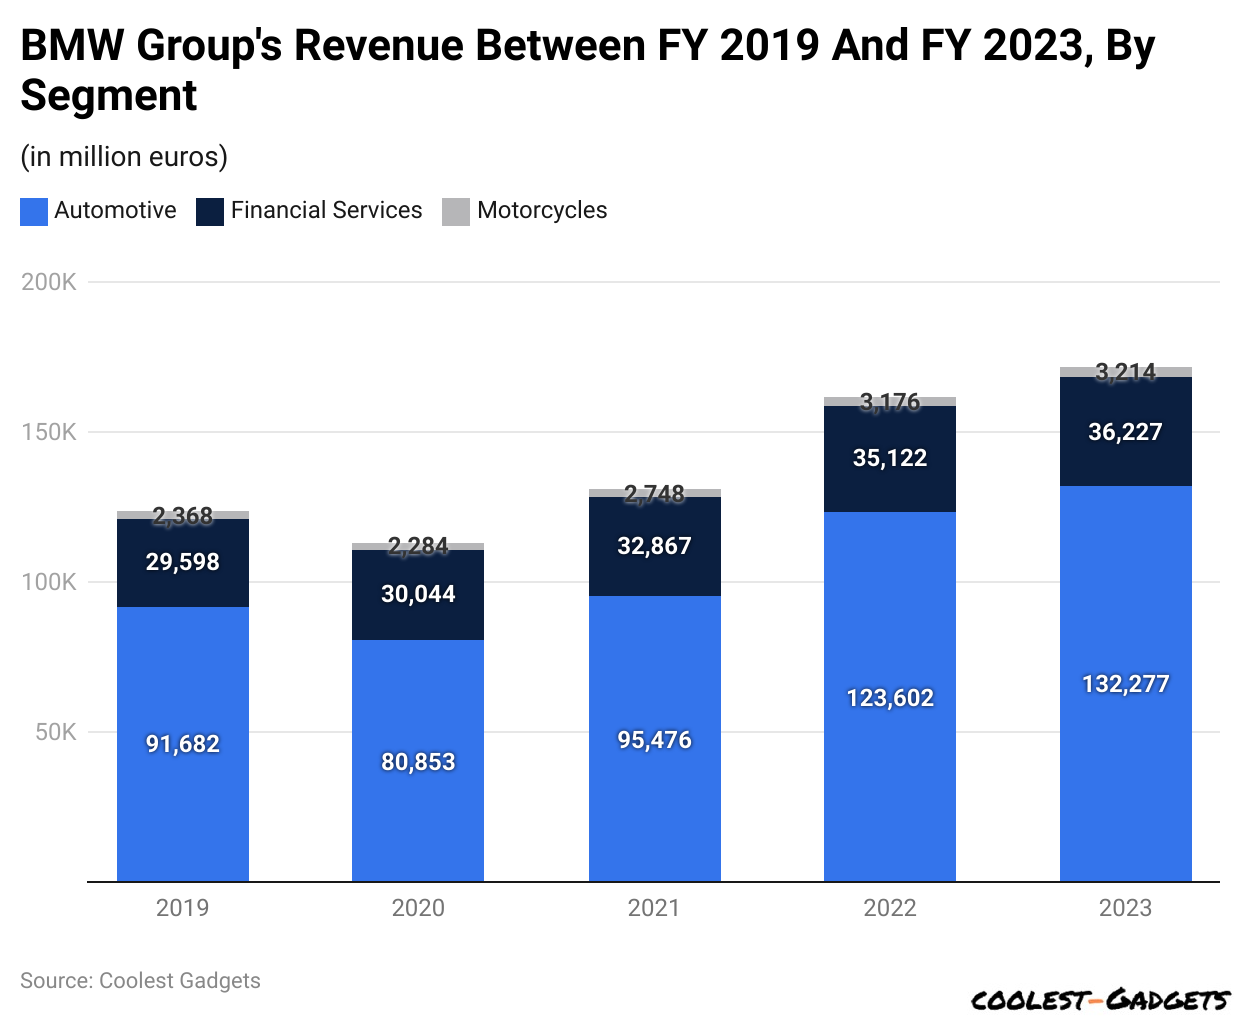
- As mentioned in BMW Statistics, BMW’s Automotive segment achieved its highest annual revenue in 2023, resulting in 132.2 billion euros (USD 141,61 billion). This was followed by Financial Services, 36.2 billion euros (USD 38.78 billion), and Motorcycles, 3.2 billion euros (USD 3.43 billion).
Additionally, segmental revenue (in USD millions) from 2019 to 2022 is detailed below in the table:
| Year | Automotive | Financial Services | Motorcycles |
| 2022 | 1,32,396.28 | 37,620.93 | 3,401.97 |
| 2021 | 1,02,269.12 | 35,205.49 | 2,943.52 |
| 2020 | 86,605.69 | 32,181.63 | 2,446.51 |
| 2019 | 98,205.17 | 31,703.90 | 2,536.48 |
BMW Automobile Sales Statistics By Region
- BMW Statistics also reports that the United States of America had the highest sales, with around 90,844 vehicles in Q1 of 2024, up by 1.2% from Q1 of 2023.
- In Europe, the combined sales of BMW and MINI vehicles totaled 227,784 units, reflecting a 5.5% increase.
- In Germany alone, 61,976 vehicles were delivered, showing a 7.6% rise.
- Despite overall growth, sales in China saw a slight decline of 3.8%, with 187,452 vehicles sold.
 (Reference: statista.com)
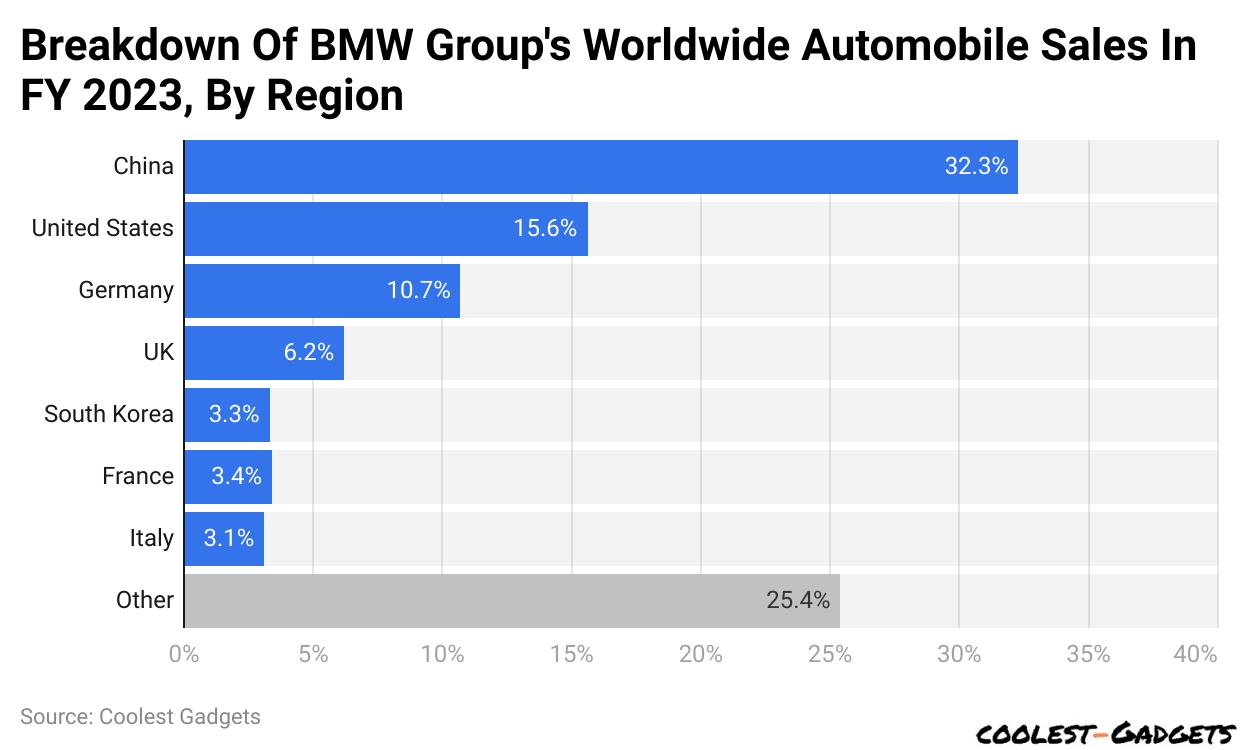
- BMW Statistics further states that in 2023, China was BMW’s largest sales market, representing a share of 32.3%, followed by the United States (15.6%).
- Meanwhile, BMW’s automobile sales share in other regions were Germany (10.7%), U.K. (6.2%), South Korea (3.3%), France (3.4%), Italy (3.1%), and rest other countries (25.4%).
BMW Group’s Statistics By Car Shipment
- In 2024, the BMW Group delivered 2,450,804 vehicles globally, marking a 4% decrease from the previous year.
- The core BMW brand accounted for 2,200,177 units, a 2.3% decline.
- Battery-electric vehicle (BEV) sales, however, increased by 13.5% to 426,594 units, representing 17.4% of total sales.
- In the United States, BMW achieved a second consecutive year of record sales, with a 2.5% increase in total sales to 371,346 vehicles.
 (Reference: statista.com)
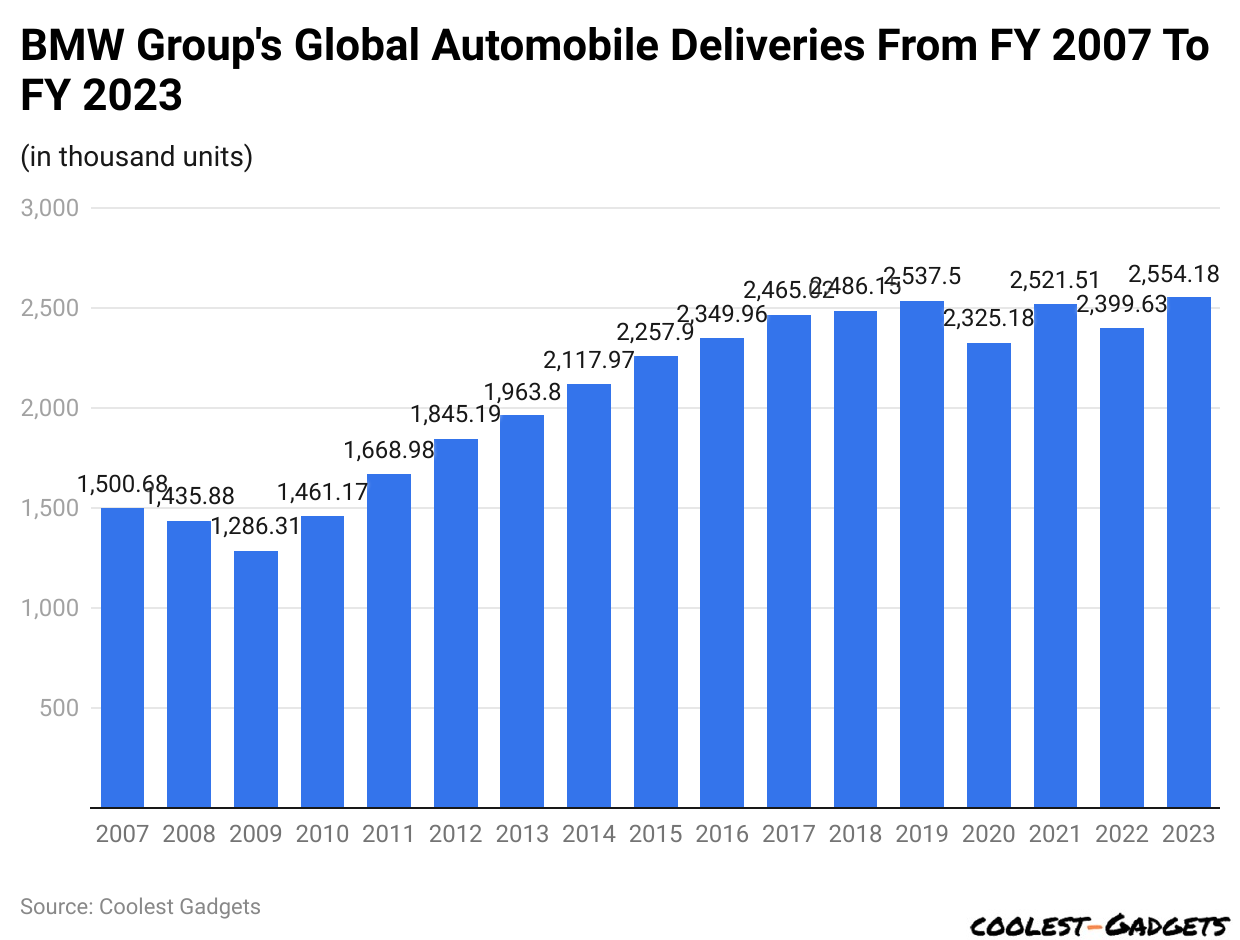
- BMW Statistics show that in 2023, Bayerische Motoren Werke AG (BMW) delivered over 2.55 million vehicles globally.
- Meanwhile, the total number of BMW car shipments (in millions) from 2007 to 2022 was 2007 (1.50), 2008 (1.43), 2009 (1.28), 2010 (1.46), 2011 (1.66), 2012 (1.84), 2013 (1.96), 2014 (2.11), 2015 (2.25), 2016 (2.34), 2017 (2.46), 2018 (2.48), 2019 (2.53), 2020 (2.32), and 2021 (2.52).
By Other BMW Delivery Statistics
- In 2024, BMW Group’s global vehicle deliveries decreased by 4%, totaling 2,450,804 units.
- The core BMW brand saw a 2.3% decline, delivering 2,200,177 vehicles.
- Despite these declines, BMW’s electric vehicle (EV) segment experienced significant growth.
- All-electric vehicle sales rose by 13.5% to 426,594 units, representing 17.4% of total sales.
- In the U.S., BMW brand sales increased by 2.5%, reaching 371,346 vehicles, marking the second consecutive year of record sales.
- Notably, U.S. sales of BMW’s electric vehicles surged by 63%, with 10,713 units sold.
- The BMW M performance division also reported its best year ever, selling 206,582 vehicles, with the electric i4 M50 emerging as the best-selling model.
- The Munich-based company BMW sold approximately 51,700 units of its electric vehicles by the end of 2023, a decrease from 61,410 units in 2022. The series was initially launched in November 2013.
- In the same duration, nearly 2.3 million BMW-branded light vehicles were delivered globally. This represents a 7.2% increase in sales compared to the previous year when Germany’s third-largest automaker shipped over 2.1 million light vehicles.
- Similarly, the company delivered approximately 375,700 battery-electric vehicles to customers worldwide, about 87.9% of which were from the group’s flagship brand, BMW.
- BMW statistics elaborate that the BMW Group delivered nearly 190,200 plug-in hybrid electric vehicles. The majority of these vehicles were sold under the group’s flagship BMW brand, while close to 16,300 MINI-branded PHEVs were delivered that year.
- On the other side, BMW also shipped more than 209,100 motorcycles in 2023, with an increase of 3.04% from last year, resulting in 202,900 motorcycles.
BMW Vehicle Sales Statistics By Segment
- In 2024, the BMW Group delivered 2,450,804 vehicles worldwide, a 4% decrease from the previous year. The core BMW brand saw a 2.3% decline, with 2,200,177 vehicles sold.
- Despite these overall declines, the company achieved a significant milestone in the electric vehicle (EV) segment: delivering approximately 430,000 battery-electric vehicles (BEVs), a 13.5% increase from the previous year.
- In the United States, BMW of North America reported a record-breaking year in 2024, with total sales reaching 371,346 vehicles—a 2.5% increase over 2023. Notably, sales of fully electric BMW models surpassed 50,000 units for the first time, with nearly half of these being i4 models.
- The BMW X5 was the best-selling model in the U.S. market in 2024, while the BMW 4-Series was the most popular sedan.
- Additionally, BMW’s M GmbH division achieved a new all-time high, delivering 206,582 vehicles globally in 2024, representing a 2.1% increase.
 (Reference: statista.com)
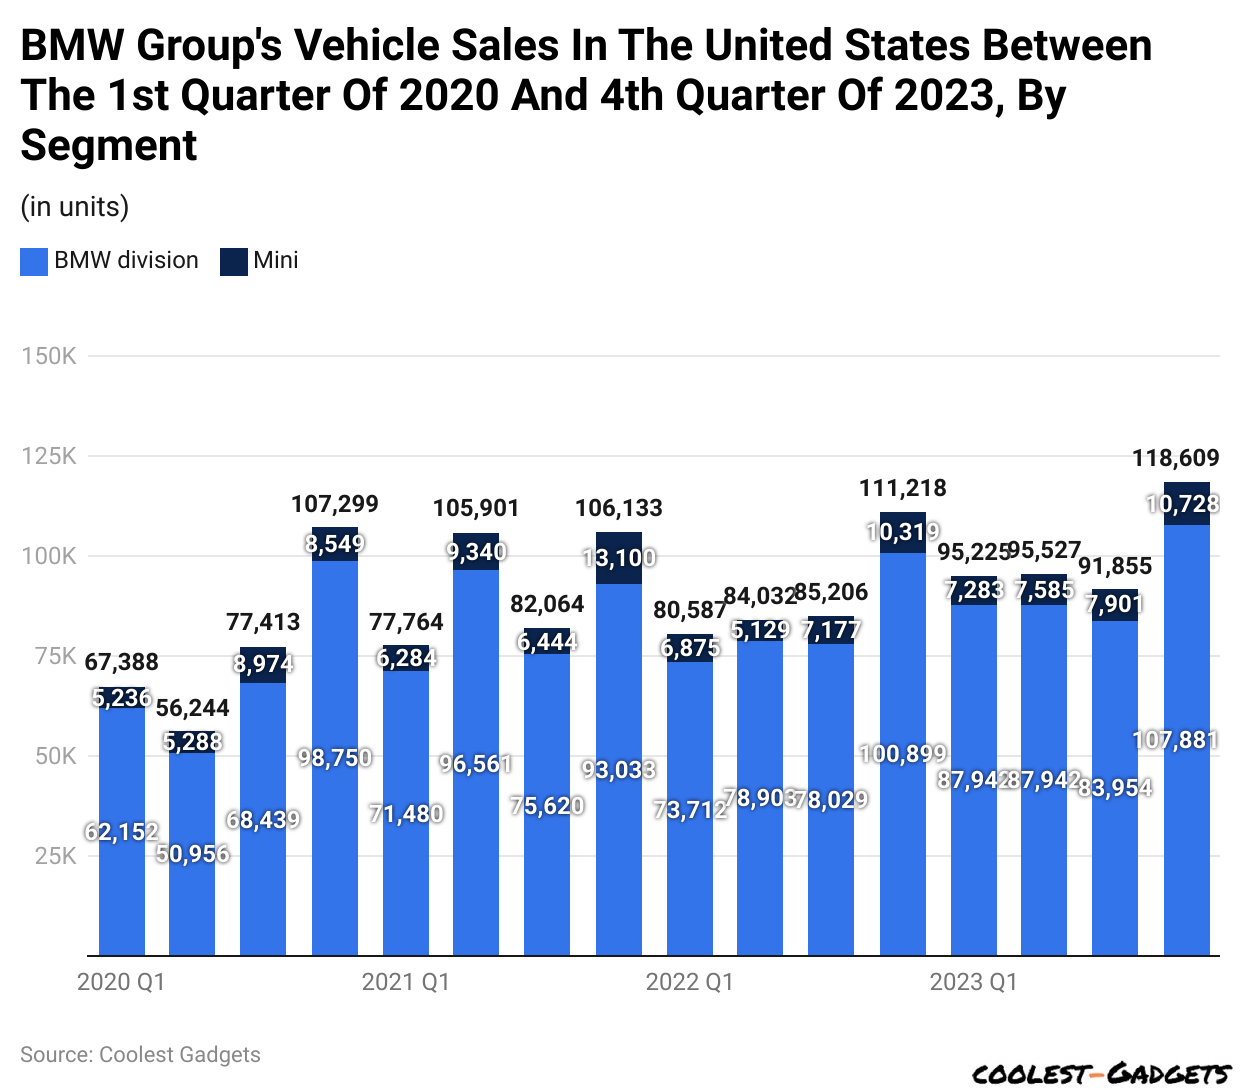
- In the fourth quarter of 2023, the BMW Group sold nearly 107,881 BMW-branded vehicles in the United States, while the Bavarian automaker sold around 10,700 MINI vehicles.
On the other hand, other quarterly BMW Group vehicles sold (in units) from 2020 to 2023 are stated below:
| Year | Q1 | Q2 | Q3 | Q4 |
| BMW division | ||||
| 2023 | 87,942 | 87,942.00 | 83,954.00 | 107,881 |
| 2022 | 73,712.00 | 78,903.00 | 78,029.00 | 100,899 |
| 2021 | 71,480.00 | 96,561.00 | 75,620.00 | 93,033 |
| 2020 | 62,152 | 50,956 | 68,439 | 98,750 |
| Mini | ||||
| 2023 | 7,283 | 7,585.00 | 7,901 | 10,728 |
| 2022 | 6,875 | 5,129.00 | 7,177 | 10,319 |
| 2021 | 6,284 | 9,340.00 | 6,444 | 13,100 |
| 2020 | 5,236 | 5,288.00 | 8,974 | 8,549 |
Luxury Car Brands Statistics By Unit Sales
 (Reference: statista.com)
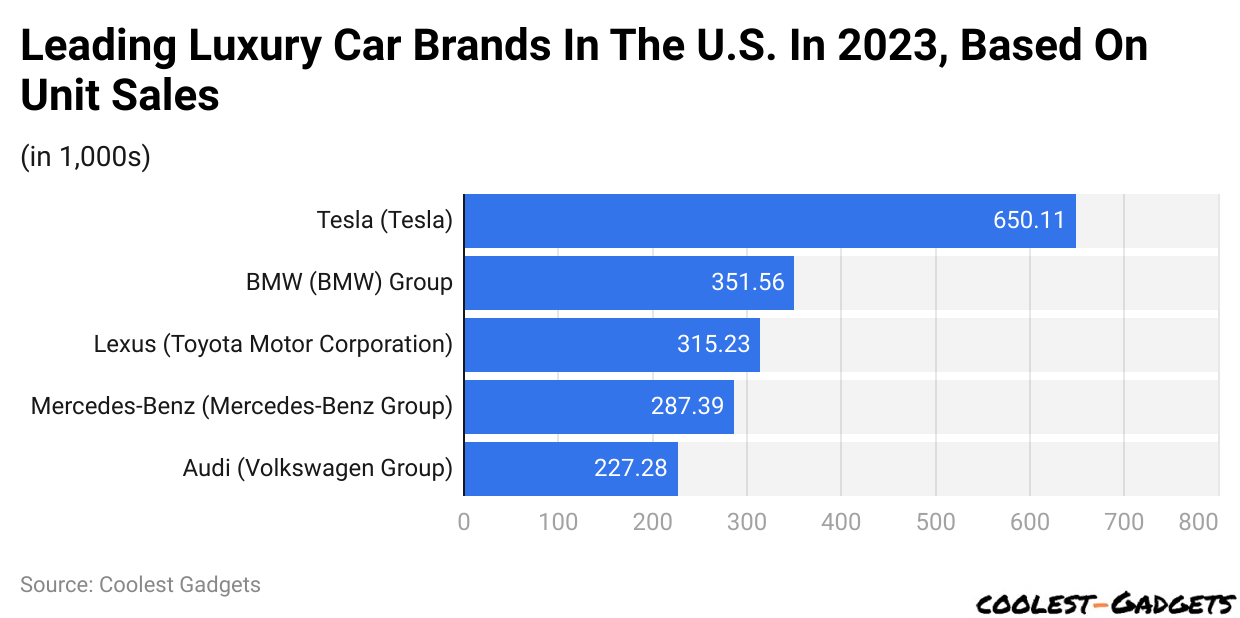
- In the United States of America, Tesla is the leading luxury car brand, accounted around 650,100 unit sales in 2023.
- The estimated sales of the BMW brand resulted in more than 351,600 units of luxury vehicles being sold, securing the second brand position.
- Furthermore, in the same period, the unit sales of other brands were Lexus (315.23), Mercedes-Benz (287.39), and Audi (227.28).
Leading Brands Statistics By Brand Value
 (Reference: statista.com)
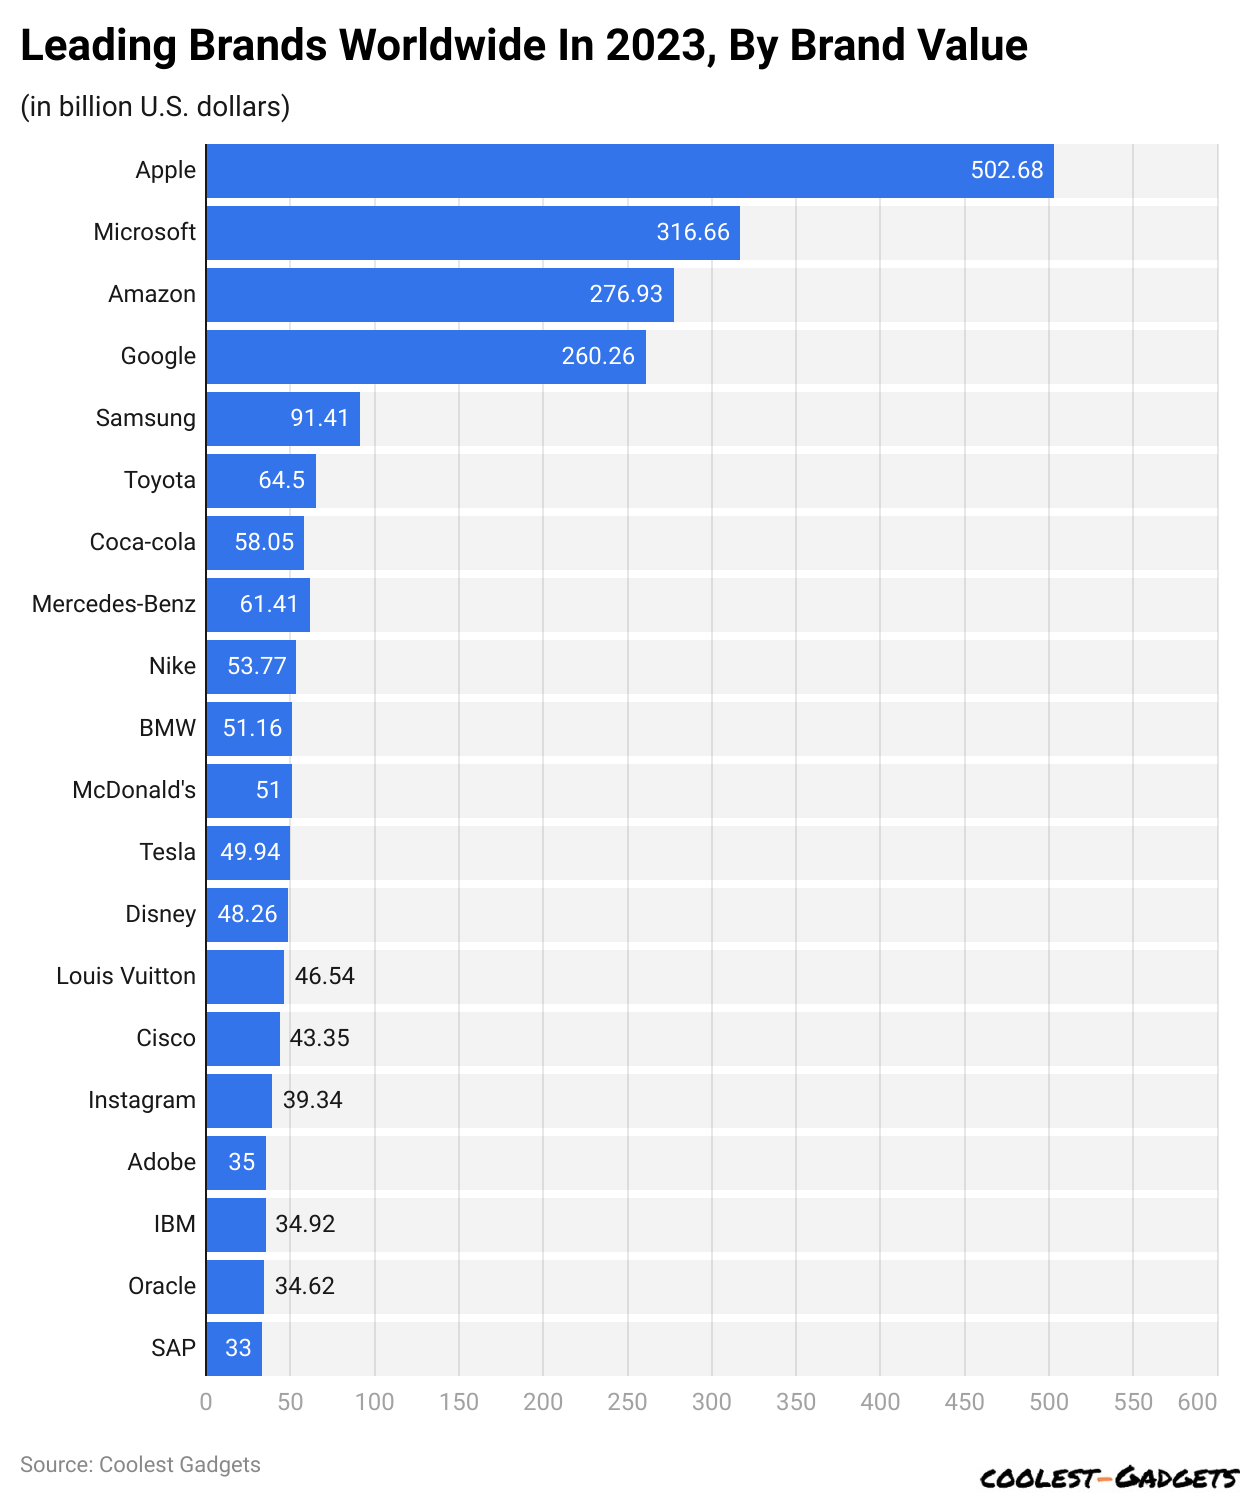
- The top ten leading tech brands across the world in 2023 followed by their brand valuation were Apple (USD 502.68 billion), Microsoft (USD 316,66 billion), Amazon (USD 276.93 billion), Google (USD 260.26 billion), Samsung (USD 91.41 billion), Toyota (USD 64.5 billion), Coca-Cola (USD 58.05 billion), Mercedes-Benz (USD 61.41 billion), Nike (USD 53.77 billion), and BMW (USD 51.16 billion).
- Furthermore, other brand values include McDonald’s (USD 51 billion), Tesla (49.94 billion), Disney (USD 48.26 billion), Louis Vuitton (USD 46.54 billion), Cisco (USD 43.35 billion), Instagram (USD 39.34 billion), Adobe (USD 35 billion), IBM (USD 34.92 billion), Oracle (USD 34.62 billion), and SAP (USD 33 billion).
BMW Statistics By Car Registration, Ownership, Imports, Export And Scrapped
| Monthly Analyses | Newly Registered | Total Registered | Change of Ownership | Imported | Exported | Scrapped |
| 2024 | ||||||
| January | 836 | 328,749 | 10,250 | 29 | 950 | 452 |
| February | 951 | 328,203 | 10,663 | 28 | 933 | 594 |
| March | 1,242 | 327,853 | 11,403 | 43 | 864 | 773 |
| April | 1,168 | 327,542 | 12,632 | 42 | 963 | 561 |
| May | 1,211 | 327,222 | 12,696 | 61 | 1,061 | 534 |
| June | 958 | 327,316 | 8,502 | 42 | 456 | 451 |
| 2023 | ||||||
| June | 1,290 | 330,183 | 12,434 | 46 | 1,110 | 383 |
| July | 939 | 329,852 | 12,047 | 43 | 1,055 | 262 |
| August | 1,505 | 329,852 | 12,306 | 50 | 1,343 | 400 |
| September | 1,236 | 329,549 | 12,793 | 53 | 1,006 | 402 |
| October | 1,340 | 329,352 | 12,189 | 51 | 1,194 | 398 |
| November | 1,427 | 329,135 | 11,288 | 31 | 1,299 | 377 |
| December | 1,369 | 329,284 | 9,571 | 32 | 901 | 354 |
(Source: car.info)
BMW Group’s Monthly Launches In 2024
| Launch Month | Name | Price | Description |
| January | BMW X1 M35i xDrive | 247,000 | The X1 M35i xDrive, launched at the Singapore Motor Show, is the most powerful X1 variant. It has a twin-turbocharged 2.0-liter engine producing 300 hp and 400 Nm of torque. |
| February | BMW i5 M60 xDrive | USD 373,000 | The i5 M60 xDrive is an all-electric performance sedan equipped with two electric motors generating a combined 517 hp, which can peak at 601 hp in Sport mode. It boasts a 0-100 km/h time of 3.8 seconds and a WLTP-rated range of up to 516 km. |
| March | BMW 5 Series | USD 57,900 | The new BMW 5 Series includes the fully-electric BMW i5. It features advanced digital systems like the BMW Operating System 8.5, a Head-Up Display, and options for in-car gaming with Air Console. |
| April | BMW X2 | Starting at USD 42,000 for the X2 xDrive28i and USD 51,400 USD for the X2 M35i | The refreshed X2 includes a sporty design. The xDrive28i features a 2.0-liter turbocharged engine, and the M35i offers a high-performance variant with additional power and M-specific features. |
| May | BMW M4 CS | USD 149,000 | The M4 C.S. is a more track-focused version of the M4, powered by a 550 hp 3.0-liter twin-turbocharged straight-six engine. It includes lightweight carbon fiber components and advanced performance features. |
| June | BMW X5 | Starting at USD 65,700 for the X5 sDrive40i, USD 73,100 for the X5 xDrive50e, and USD 90,000 for the X5 M60i | The 2024 BMW X5 lineup includes both combustion and plug-in hybrid variants. The X5 M60i features a powerful V-8 engine, while the X5 xDrive50e combines a turbocharged inline 6-cylinder engine with an electric motor for enhanced efficiency. |
| July | BMW M3 and M3 Touring | – | The updated M3 and M3 Touring feature minor facelifts and a power boost to 530 hp from their 3.0-liter twin-turbocharged engines. |
| August | BMW 4 Series and M4 | – | The facelifted 4 Series and M4 include design tweaks and an engine upgrade for the M4, which now produces 530 hp. |
You May Also Like To Read
- Ferrari Statistics
- Fiat Statistics
- Ford Statistics
- General Motors Statistics
- Honda Statistics
- Hyundai Statistics
- Infiniti Statistics
- Isuzu Statistics
- Jaguar Statistics
- Jeep Statistics
- Kia Statistics
BMW Website Traffic Statistics By Country
 (Reference: similarweb.com)
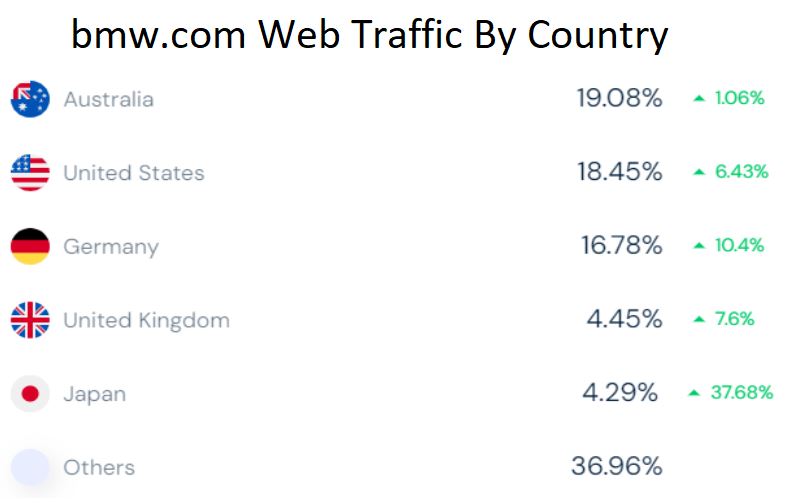
- BMW Statistics 2024: Australia had 19.08% of BMW’s website’s total traffic, up by 1.06%.
- During the same duration, other countries recorded the following contribution in total traffic: the United States of America = 18.45% (+6.43%), Germany = 16.78% (+10.4%), the United Kingdom = 4.45% (+7.6%), and Japan = 4.29%.
- Other countries collectively made up around 36.96% of visitor share on bmw.com.
By Demographics
 (Reference: similarweb.com)
- BMW Statistics also show that in May 2024, the majority of visitors to bmw.com were male (70.92%), while females made up 29.08%.
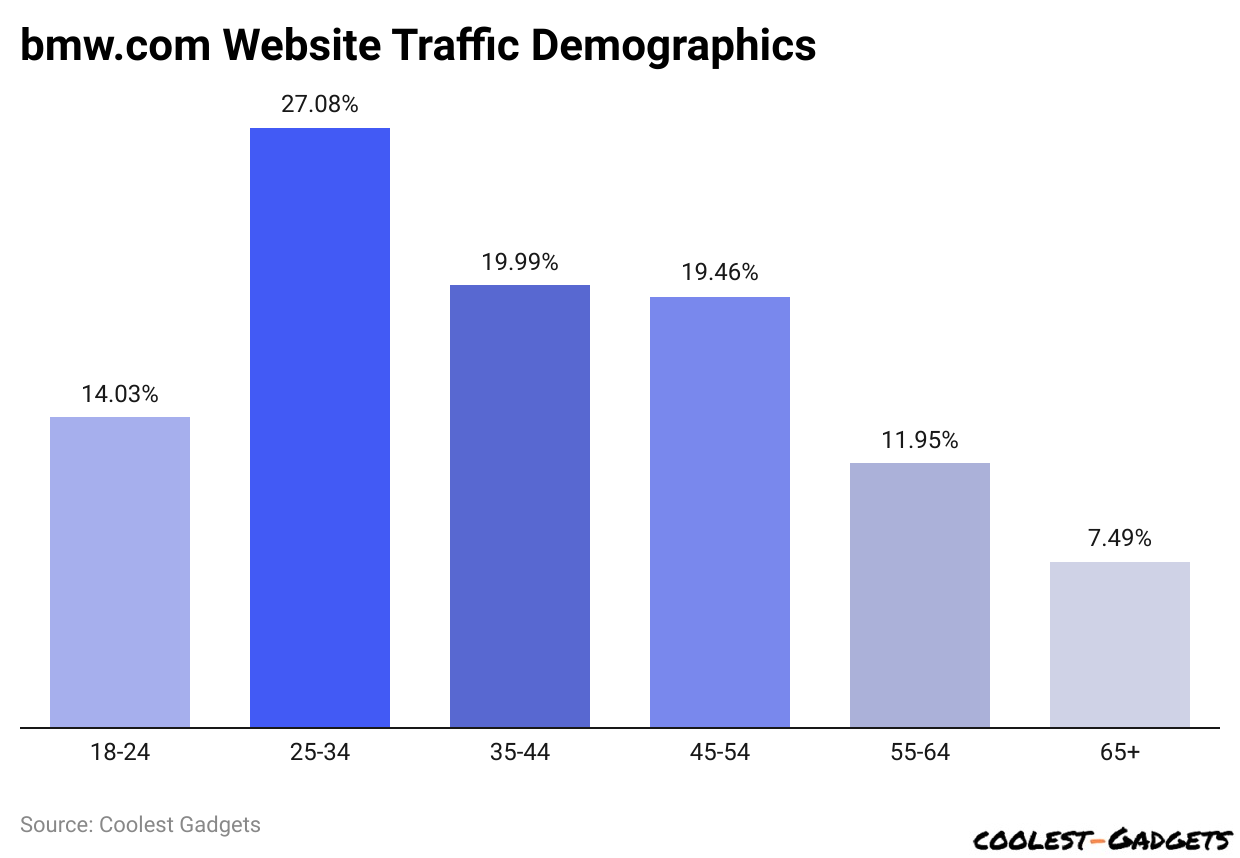
- The largest age group of users was 25 to 34, accounting for 27.08% of the total.
- Users aged 35 to 44 made up 19.99%, while 19.46% were between 45 and 54 years old. Those aged 18 to 24 contributed 14.03% of the traffic.
- Around 11.95% of visitors were between 55 and 64 years old, and about 7.49% of users were 65 years or older.
By Traffic Source
 (Reference: similarweb.com)
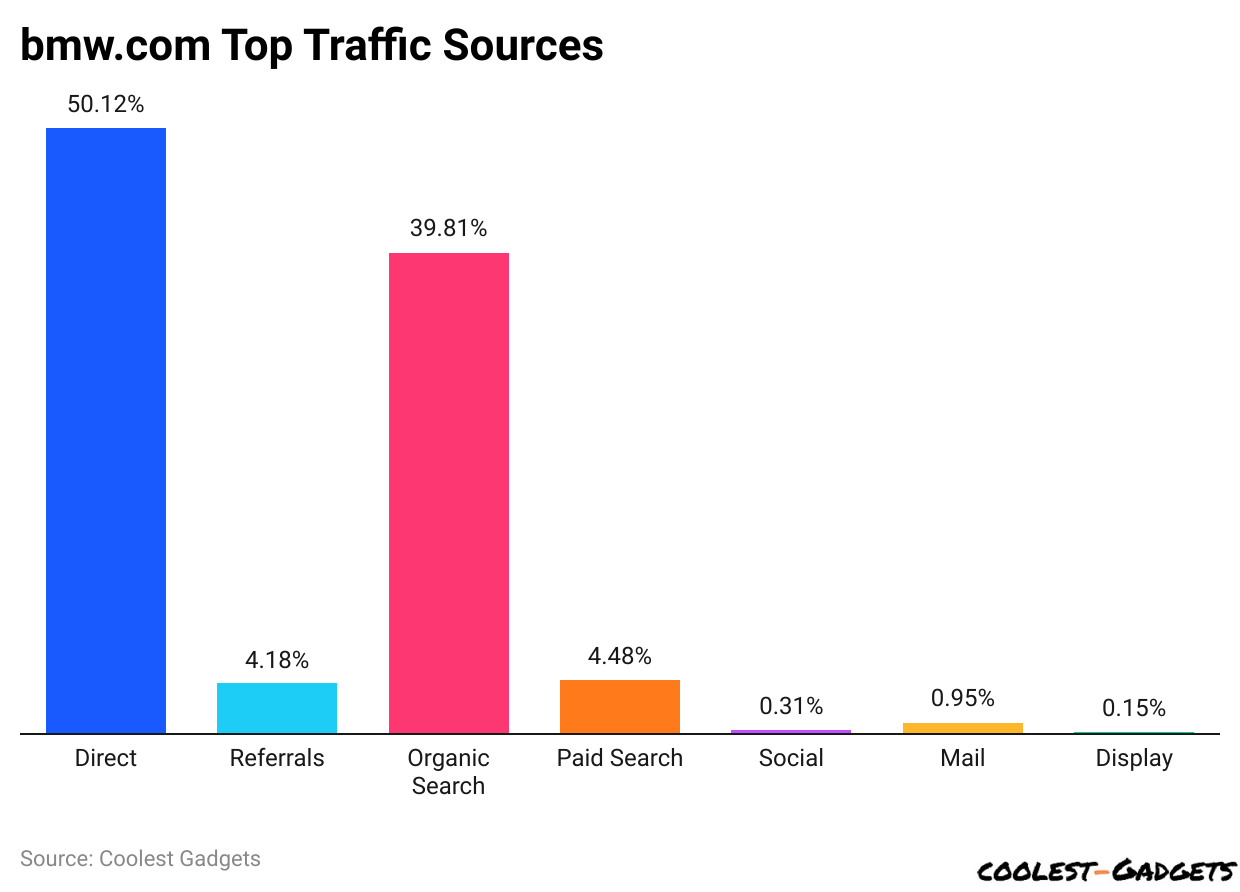
- BMW Statistics 2024 also shows that direct search generated the highest traffic rate to bmw.com, 50.12%.
- Almost 39.81% of the share is generated by organic traffic searches, while 4.48% is from paid searches.
- Furthermore, the BMW website’s other traffic sources are referrals (4.18%), social (0.31%), mail (0.95%), and display (0.15%).
By Social Media Referral Statistics
 (Reference: similarweb.com)
- BMW Statistics reported that Twitter had the highest social media referral rate, with a 40.39% share compared to other social network traffic.
- YouTube and Reddit each contributed a share of 39.66% and 7.7% on bmw.com.
- Meanwhile, traffic sent by Facebook was 7.02%, and WhatsApp contributed 3.09%.
- Similarly, the rest of BMW’s website’s social networks together made up around 2.14% of the traffic share.
BMW’s Sustainable Initiatives
CO2 Emission Reductions:
- Starting in 2024, BMW and MINI will make all their cast aluminum wheels using only green electricity.
- This change will cut CO2 emissions by more than half.
- BMW also plans to lower CO2 emissions in its supply chain by 20% before 2030.
- To achieve this, the company has signed over 400 agreements with suppliers to use only green electricity, especially for materials like aluminum and steel, which produce high emissions.
- By 2030, BMW aims to reduce CO2 emissions per vehicle and per kilometer driven by 50%.
Circular Economy:
- BMW Statistics 2024: The new generation of the MINI Countryman will feature light-alloy cast wheels made from 70% secondary aluminum, reducing CO2 emissions by up to 80%.
- The BMW i Vision Circular concept vehicle, designed to be 100% recyclable, showcases BMW’s vision for a circular economy.
- The company operates a dismantling and recycling center near Munich, where up to 10,000 vehicles are recycled annually.
Electrification:
- BMW offers more than 15 fully electric models, including the BMW i5 and iX5. The company has also seen a 27.9% increase in BEV sales in the first quarter of 2024.
- The sixth generation of BMW’s lithium-ion batteries will improve range by up to 30% and charging speed by up to 30% while reducing CO2 emissions from production by up to 60%. These advancements will be first seen in the NEUE KLASSE models starting in 2025.
Sustainable Materials:
- As of 2023, BMW and MINI models will feature fully vegan interiors, including vegan leather-like materials for steering wheels. This will reduce carbon emissions by approximately 80% compared to conventional leather, as mentioned in BMW Statistics.
- The brand also incorporates recycled materials, such as old fishing nets and ropes, into its vehicle components, such as plastic paneling in NEUE KLASSE models. Up to 30% of the paneling will consist of recycled materials, resulting in a 25% lower carbon footprint.
Conclusion
Xiaomi is a well-known technology company that makes smartphones, smart devices, and other electronic products. The company is popular for offering high-quality gadgets at affordable prices. Over the years, Xiaomi has grown quickly and expanded into many countries. It focuses on innovation and customer satisfaction, which has helped it compete with big brands. Xiaomi also invests in artificial intelligence and smart home technology. Despite challenges like market competition and regulations, it continues to improve its products. With strong customer support and advanced technology, Xiaomi is expected to remain a major player in the global tech industry.
Sources
Barry Elad is a tech enthusiast passionate about exploring various technology topics. He collects key statistics and facts to make tech easier to understand. Barry focuses on software and its benefits for everyday life. In his free time, he enjoys creating healthy recipes, practicing yoga, meditating, and walking in nature with his child. Barry's mission is to simplify complex tech information for everyone.